Aaronia presents our real-time spectrum analysis software for the Aaronia devices of the SPECTRAN V3, V4 and NF series. The MCS works with Windows, Linux and MacOS and supports all screen resolutions, including 4k and 8k
Our latest MCS Real-Time Spectrum Analyzer Software includes lots of great features like:
• Runs with any operation system like MAC OS, Linux and Windows • Real-Time remote control with any Spectran Spectrum Analyzer • Supports a unlimited number of Pre-Compliance limits displays like EN55011, EN55022 etc. incl. various separate limit curves and bar displays • Multi window support • Powerful Undo-Feature • Channel and provider display • Fully customizable skins and look • Report and record function • And more…
Customer wishes regarding the software are very helpful in the further development of the MCS.
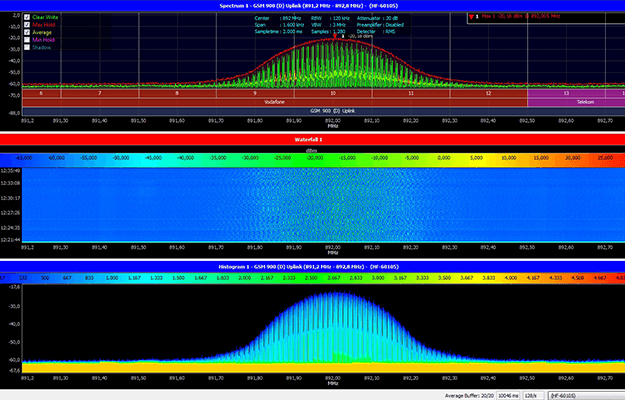
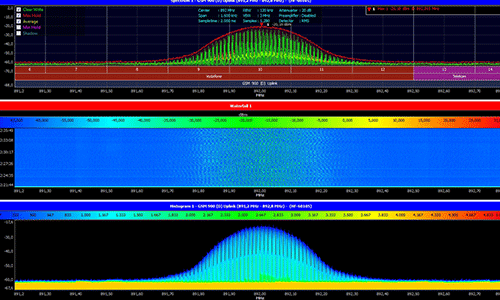
Spectrum Analysis
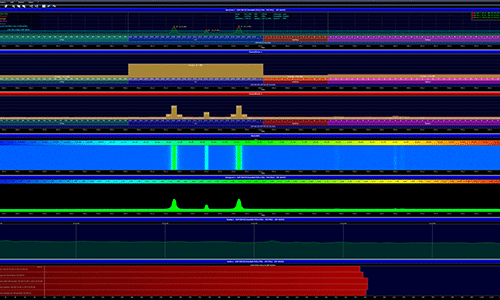
Multi Window
Recording & Playback
• High-resolution spectrum display of Clear Write, AVG, Min / Max, Shadow, Peak, RMS etc. • Provider display with variety of prestored providers and editor for creating own providers • Marker function with unlimited number of markers (MIN, MAX, AVG, Delta, OBW, etc.) • Supports custom skins and styles, complete surface freely customizable • Intuitive operation (drag & drop, zoom, shortkeys etc.)
• Supports unlimited number of graphics (spectrum, waterfall, histogram, etc.) • Window sizes freely adjustable, Software supports each resolution (even 4k monitors) • Simultaneous view and control of multiple Spectran units with independent settings • Creation of “pseudo” Spectran’s measuring various signals with different scanning parameters and frequency ranges (eg GSM, WLAN and Tetra)
• Storage of each measurement and personal sessions • Replay function, recorded measurements can be replayed in full length • Print function, direct print-out (also as pdf) of the results / graph • No limitation of the recording size (besides hard drive).
Waterfall
Histogram (dot, line and fill)
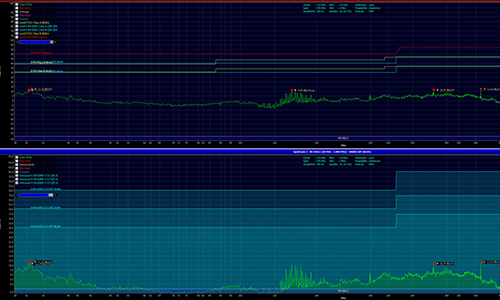
Multiple Limits/Custom Limits
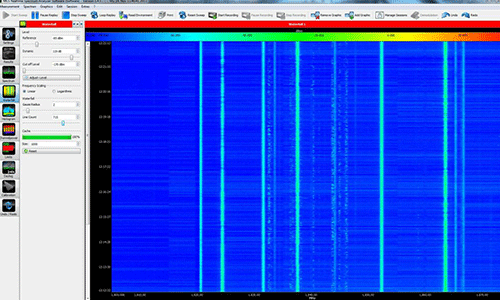
• Measurement data in form of a “heat map” in the frequency (X-axis) and time-plane (Y-axis) • Better analysis of time-based signals, perfect for long-term measurement • Ongoing storage and scrolling of the Waterfall • Freely scalable and adjustable
• Statistic view of frequently measured results within a “Sweep Area” • Perfect for identification & characterization of sporadic interference, no results get lost • Freely scalable and adaptable
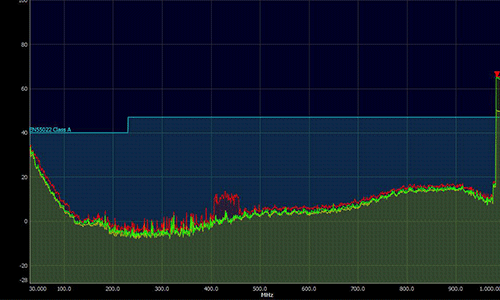
• Multitude of presaved limits (e.g. EN55011, EN55022, ICNIRP), displayable as graph or bar chart • Average values, maximum values, period for Max, AVG calculation etc. freely adjustable • Limit Editor to store and edit own limits • Trigger function, free programming of alarms or messages for exceeding presaved limits • Image suppression mode, suppression of ambient interferers (e.g. GSM, 3G, Radio) to perform EMC measurements without an EMC chamber