RTSA-Suite Pro Software

Overview

RTSA Suite PRO is the world’s fastest real-time spectrum analysis software on the market and was developed specifically for our latest SPECTRAN® real-time instruments. It allows various hardware components to be integrated and used for evaluation. A simple configuration via blocks in the software allows optimal settings for almost all measurement scenarios. Among other things, the complete control of our AARTOS drone detection system with all associated components (e.g. camera, jammer, etc.) is possible.

The highlights of the software include the seamless real-time 3D view with up to 25 million samples/sec, unlimited recording time, automatic signal classification and remote controllability. The comparatively low system requirements also allow working on “normal” PCs. The software is regularly extended with new features and is available for Windows and Linux (MacOS in development).

The RTSA Suite is intuitively configurable via drag&drop to connect different hardware, no matter how complex, and to adjust settings/views according to your wishes. With this system there are no limits, because there is also the possibility to program your own blocks.

.

The RTSA Suite PRO offers great possibilities for spectrum analysis;

245 MHz Real-Time Bandwidth

With 245MHz, the SPECTRAN® V6 achieves by far the highest 24/7 streaming real-time bandwidth in its class. Until now, only 27MHz or 40MHz of gapless data transmission were available on the market. The V6 sets completely new standards with its 245MHz bandwidth. The impressive screenshot demonstrates the advantage of a high real-time bandwidth: Whereas with 40MHz only a small area of the Wi-Fi would be visible, with 245MHz the entire Wi-Fi band and LTE can be monitored simultaneously in real time. This is also indispensable for all broadband signals such as Wi-Fi 6.

>1THz/s Sweep Speed

The SPECTRAN® V6 only needs 5ms to cover the entire frequency range of 6GHz. Therefore it sweeps even faster than the human eye could detect. This is an absolute novelty in the USB compact class and enables new measurement possibilities. This screenshot demonstrates a very impressive measurement: Even short signals such as Bluetooth, DECT etc. are easily reproduced by the POI of only 5ms and thus enable a quasi real-time display of the entire frequency spectrum from TETRA to GSM, LTE, 5G and 5GHz Wi-Fi in previously unknown detail.

10ns POI

The extremely low POI of 10ns (97ns via FFT) enables completely new measurement possibilities that were previously unattainable for a USB spectrum analyzer. Even extremely short radar bursts in the nanosecond range can now be analyzed in detail: The screenshot shows a phase-modulated radar burst of only 7µs, which can still be displayed with a temporal resolution of 100ns. Now you get a detailed analysis of your Barker codes in length 13.

IQ Recording with Full Bandwidth

The powerful Record & Replay function of the SPECTRAN® V6, together with the RTSA-Suite PRO, enables recording and replay of the FULL IQ bandwidth of up to 245MHz. This was previously reserved for extremely expensive benchtop devices. 24/7 recording is only limited to the size of your optional external hard-drive. An SSD drive is ideal but not necessary. When recording to the drive, old data will be overwritten with new data when storage is limited by utilizing our “smart buffering” (FIFO function).

Increased Real-Time Bandwidth Through Receiver Stitching

Several SPECTRAN® V6 units can be coupled using the RTSA-Suite PRO software in order to increase the real-time bandwidth as required. The NYQUIST sensitivity is a special feature that extends the bandwidth of the individual receivers. This enables a highly sensitive measurement despite the high real-time bandwidth. There are only four V6 receivers with 245MHZ RTBW needed to achieve approx. 1GHZ.


-170dBm/Hz DANL

The extremely high sensitivity of the SPECTRAN® V6 makes it possible to measure even extremely weak signals, which was only achieved by benchtop analyzers. Hidden or faint signals can be easily detected by the first-class DANL on board. The impressive screenshot shows signals around -170dBm can still be detected with an RBW of 1Hz.


Real-Time EMC Measurement

EMC measurements in real-time are achieved by the enormous real-time bandwidth of up to 245MHz as well as the ultra-fast sweep speed of the SPECTRAN® V6 This means that the success of changes, such as taking interference suppression and shielding measures, can be determined and evaluated immediately. The simultaneous display of several limit values increases the speed of the measurement considerably, as they no longer need to be carried out individually. The screenshot shows a simultaneous live measurement according to EN55015 and EN61800-3 standard with visual feedback in case of non-compliance with the limit values (marker in red).

Powerful IQ Signal Generator

The software IQ signal generator enables the generation of a variety of modulation types. Several signals can also be combined. Among others, the following standards are supported: CW & Sweep (incl. single carrier, multiple carrier, ramp function, carrier list, etc.), Noise (within -200dBm to 0dBm), Pulse (up to 10nS Pulse and Pause Rate), FSK (with up to 20MHz Symbol Rate), QAM (BPSK, ASK, QPSK, QPSK-C, 16-QAM, 64-QAM, 256-QAM, 1024-QAM, 4096-QAM with up to 20MHz symbol rate), OFDM (BPSK, QPSK, QAM16, QAM64, QAM256, QAM1024, QAM4096), Rasterimage (Load a JPG, PNG, BMP or TIFF image and convert it to IQ), Echo/Reflection. The illustration shows how different 2D and 3D IQ demodulators display a 16QAM modulation. These units are required to reach these measurement standards.

IQ Data Reduction

With the help of the IQ demodulator block, you can extract single or multiple frequencies range from a complex IQ data stream. A unique feature to the SPECTRAN® V6. This makes massive data reductions or narrowband decoding of several signals possible. Here are two QAM signals that are tapped individually and decoded independently of each other.

3D IQ Constellation Diagram

The 3D IQ constellation diagram is another special feature of the RTSA-Suite PRO software, as constellation diagrams can only be seen in 2D; Here is a 3D DAB signal (digital radio) with a 2048 FFT. The data is displayed in real time and can be rotated, compressed, and zoomed as desired. You have never experienced IQ data like this before – a unique form of display.

Deep Memory FFT

The RTSA-Suite PRO offers, thanks to a tricky deep memory folding algorithm, an extremely high-resolution FFT display with up to 1 million points. Another unique feature allows the entire FFT to be stored in memory. With this amount of data and detail stored from the spectrum, one can now zoom in for greater clarity to evaluate multiple complex carriers as demonstrated in the screenshot.

High Resolution Spectrum View

The “Wrapped Spectrum” view is another unique, patented spectrum monitoring feature that is only available for the RTSA Suite PRO and offers super-high spectrum resolution by “wrapping” the spectrum using multiple lines (1-8). In the screenshot you can see a spectrum from 750MHz to 2.6GHz split into six lines. This uses six times the screen resolution (here a 4K screen resolution: 3840 pixels x 6 = 23040 pixels) to display the complete frequency range. This provides the ultimate overview, especially since the frequency profiles are also displayed here (e.g. Bluetooth, LTE).

3D QAM Display

A real-time 3D view of a 16QAM modulation. The view can be rotated or compressed in real time. Various lighting and color settings are available. You have never seen QAM like this before.
A real eye-catcher.

Powerful Trigger

Modifiable trigger masks and/or logical operations simplify the acquisition of even shorter signals. In addition, triggers and filters can also be created in relation to pulse lengths, frequency, signal density, etc. For example, Bluetooth and WiFi can be separated from each other. Even cascading of several trigger stages is possible.

High Resolution Histogram

The Histograms crystal clear view only RTSA Suite PRO can offer. Extremely high resolution and complex color settings for signal density bring out even the smallest differences. The multifunctional density marker leaves nothing to be desired.

Low-Noise Preamplifier

The optional ultra-low-noise preamplifier of the SPECTRAN® V6 offers up to 20dB higher sensitivity and a DANL of -170dBm/Hz. The impressive results can be seen in this screenshot: Two combined spectra, each with (left representation) and without (right representation) preamplifier. The difference is striking.

3D Histogram

The RTSA-Suite PRO offers a variety of new display formats for your measurements. How about a histogram view, for example, in 3D? No problem with the RTSA Suite PRO. Here you can see a WiFi and Bluetooth signal as a 3D histogram.

Measurement Made Easy

RTSA Suite PRO consists of building blocks that are configured in a flow chart to form a measurement (mission). The mission can then be started. A typical yet simple mission can be seen in the screenshot above. The SPECTRAN® V6 sends out its IQ data to the FFT, which in return sends the Spectra data simultaneously to the histogram, the waterfall and the spectrum. Up to now, a measurement was hardly possible in such a simple and individual way.

Complex Is Also Clear

For a more complex mission: The SPECTRAN® V6 simultaneously supplies the IQ data of Rx1 and Rx2. The IQ data of the Rx1 is streamed to the local hard disk for recording with the help of the file writer (IQ Recorder). At the same time, the IQ data of the Rx2 is streamed seamlessly to an HTTP client via an HTTP server over the Internet or a local network. Finally, various IQ blocks are also integrated for extended data visualization.

Infinite Possibilities

Currently available “blocks” of the RTSA Suite PRO as an overview. Many blocks are already available free of charge in the basic version: Various 2D and 3D views, IQ processing, Trigger, AM/FM Decoder, File reader, File writer, Remote HTTP, Scripts etc., etc. Optionally, additional blocks can be purchased at any time, 30-day free trials or rentals are also available. 

3D Waterfall

The 3D visualization of the RTSA-Suite PRO leaves nothing to be desired. Here is a waterfall in 3D representing the 2.4GHz WiFi band. Bluetooth and WiFi are displayed in real time and with extremely high resolution. The display can be rotated and compressed super smoothly without jerking in real time. Experience data visualization like you have never seen before.

3D Long-Term Measurement

Even extremely high data volumes can still be displayed with the help of the flexible time compression of the 3D views. Here a battery charger and its harmonics or spurious over a long period of more than 20 minutes. The frequency drift over this time is almost a work of art.

Demodulation of Digital Standards

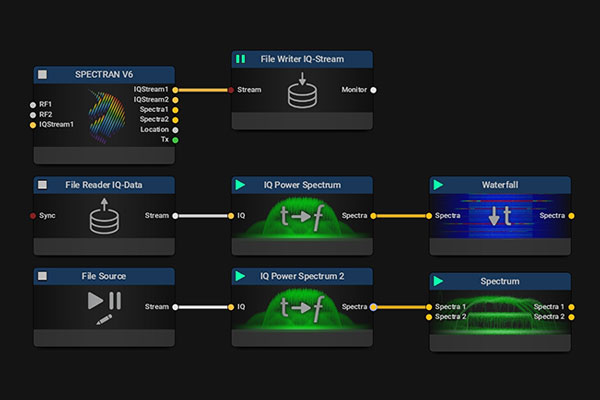
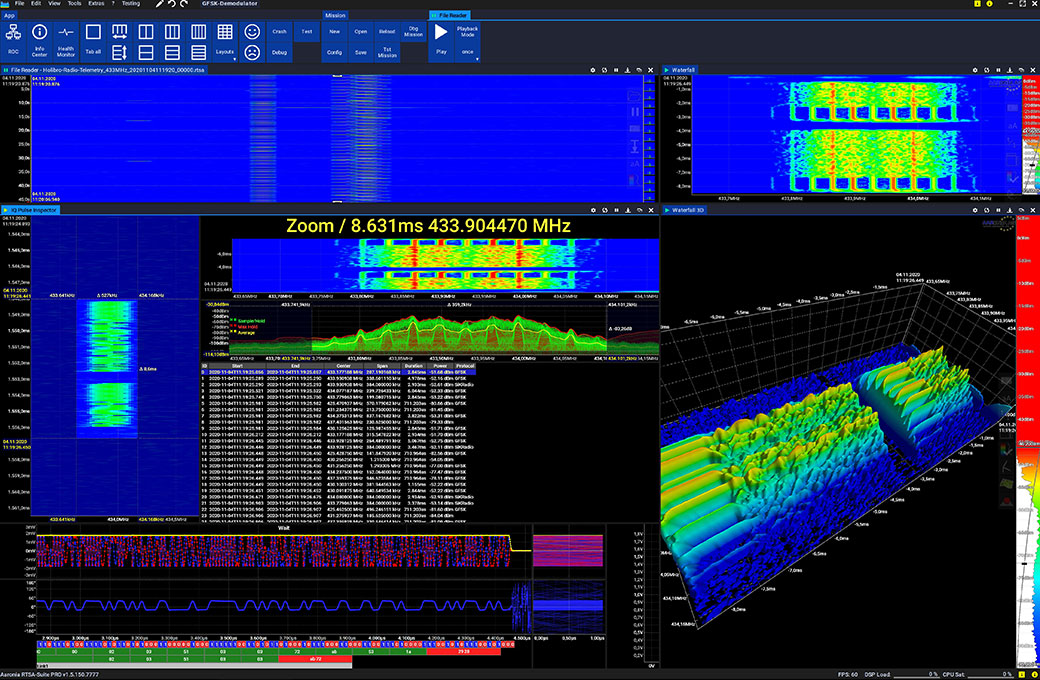
The IQ Pulse Inspector Block is a powerful tool and enables decoding a wide range of digital standards. The detection is completely automatic. Among others, the following standards are supported: Auto, Auto Basic, ASK, FSK, GFSK, BPSK, DBPSK, PSK, QPSK, QPSK_C, DQPSK, P4DQPSK, 8DPSK, QAM16, QAM64, QAM256, QAM1024, Bluetooth LE (Low Energy), Bluetooth EDR 2M, Bluetooth EDR 3M, DECT, GSM, WiFi 802. 11b, Wi-Fi 802.11g (5MHz), Wi-Fi 802.11g (10MHz), Wi-Fi 802.11g (20MHz), Enhanced Shockburst

Channel Power Measurement

The Channel Power Block enables a detailed channel power measurement: In addition to the graphical real-time display of the spectrum, the secondary channels, the CHP, ACPR/ACLR and OBW are automatically measured and continuously displayed. At the same time, all channels in the entire spectrum and their individual power can be visualized in real-time. Here the DECT band together with all current carriers.

Harmonics Measurement

The measurement of harmonics is done by our “Harmonics Spectrum Analyzer” block: Up to 11 harmonics can be measured simultaneously. The number of harmonics, as well as the RBW and span, are freely adjustable to ensure the best possible measurements. The THD and percentage display are automatically updated after each measurement.

Real-Time 3D Direction Finding

The RTSA Suite PRO, together with our IsoLOG 3D DF antenna, offers real-time 3D signal direction finding in under 1µs. Any number of transmitters across the entire frequency spectrum can be simultaneously located, even with an extremely high accuracy of less than one degree. A powerful map view including 3D topography, 3D buildings, and RF propagation models complete the 3D direction finding software package. Real-time cross bearings through several antennas or utilizing a radio measurement truck are also supported. With these features, even the GPS position and the height of the transmitters are determined. A totally unique feature. Furthermore, cameras (incl. tracking), jammers and radars can be integrated. A powerful software package that leaves nothing to be desired.

Spectrum Analysis in 3D

Waterfall in 3D

Simple configuration via blocks

High-resolution spectrum display with Clear/Write, Min. Hold, Average, reference curves, provider display, limit value curves, adjustable dynamics as well as freely adjustable colors and resolution, here in 3D are only a small excerpt of the almost infinite analysis and display possibilities of our software.

Our 3D real-time waterfall display with enormous depth of detail, free rotation and three-dimensional cursor allows an unprecedented visualization of your measurement. At the same time, you can zoom into the signal in the time domain as well as in the frequency domain and the data volume of the time domain can be compressed steplessly.

The RTSA Suite can be intuitively configured via drag&drop to connect a wide variety of hardware, however complex it may be, and to customize settings/views according to your needs. With this system there are no limits, because there is the possibility to program your own blocks. So the system can also be used for large installations with hundreds of sensors and effectors (monitoring of entire cities, border installations or even nationwide installations).

Receiver Stitching

3D IQ Data Display

Super High Frequency Resolution

Multiple receivers can be combined into a single device using our software. This results in a much higher real-time bandwidth while maintaining the sensitivity of the individual receivers. This unique feature enables real-time monitoring over wide frequency ranges. For example, only 4 receivers are required for a frequency range of 1 GHz.

Here using an ADS-B transmitter. The data is displayed in real time and can be rotated, compressed and zoomed. So the signal analysis was not yet possible.

Our software allows any cascading of the frequency display. Thus the visual resolution of the time domain can be set arbitrarily. The demo shows the frequency range up to 6 GHz in 8 cascades, each with a resolution of about 700 MHz. So single carriers and signals can be visualized in a resolution never known before.

2THz/s Ultra Wideband Monitoring

Record & Playback

Our latest highlight is our V6 receiver. Its unbelievable sweep speed of over 2 THz/s enables an unprecedented speed in radio monitoring. For example, the entire frequency range up to 6 GHz can be analyzed and measured several hundred times per second. Additionally these data can be streamed lossless. This is UNIQUE in the industry and will fundamentally change the measurement technology as we know it.

The powerful Record & Replay function allows unlimited recordings and 1:1 replays. There is no limit to the recording duration, files are split into max. 1GB partitions. Enables detailed evaluation, analysis and subsequent demodulation of the most complex signals